Open Interest
future trading.
Open Interest and its calculation
Before we conclude this module on “Futures Trading”, we must address one of the questions that is often asked- “What is Open Interest (OI)?”, “How is it different from Volumes?”, and “How can we benefit from the Volumes and Open interest data?” Let me attempt to answer these questions and more in this chapter. After reading this, you will be able to interpret OI data in conjunction with the Volumes to make better decisions while trading. Also, I would suggest you refresh your understanding on Volumes from here.
Open Interest (OI) is a number that tells you how many futures (or Options) contracts are currently outstanding (open) in the market. Remember that there are always 2 sides to a trade – a buyer and a seller. Let us say the seller sells 1 contract to the buyer. The buyer is said to be long on the contract and the seller is said to be short on the same contract. The open interest in this case is said to be 1.
Let me illustrate OI with an example. Assume the market consists of 5 traders who trade NIFTY futures. We will name them Arjun, Neha, Varun, John, and Vikram. Let us go through their day to day trading activity and observe how open interest varies. Please note, you need to exercise some patience while understanding the flow of events below, else you can quite easily get frustrated!
Lets get started.
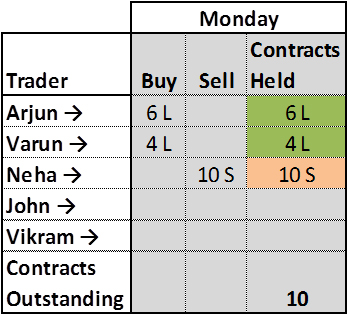
Monday: Arjun buys 6 futures contracts and Varun buys 4 futures contracts, while Neha sells all of those 10 contracts. After this transaction, there are 10 contracts in total with 10 on the long side (6 + 4) and another 10 on the short side; hence the open interest is 10. This is summarized in the table below.

Tuesday: Neha wants to get rid of 8 contracts out of the 10 contracts she holds, which she does. John comes into the market and takes on the 8 shorts contracts from her. You must realize that this transaction did not create any new contracts in the market. It was a simple transfer from one person to another. Hence the OI will still stand at 10. Tuesday’s transaction is summarized in the table below

Wednesday: To the existing 8 short contracts, John wants to add 7 more short positions, while at the same time both Arjun and Varun decide to increase their long position. Hence John sold 3 contracts to Arjun and 2 contracts to Varun. Note, these are 5 new contracts created. Neha decides to close out her open positions. By going long on 2 contracts, she effectively transferred 2 of her short contracts to John and hence Neha holds no more contracts. The table now looks like this:

By the end of Wednesday, there are 15 long (9+6) and 15 short positions in the market, hence OI stands at 15!
Thursday: A big guy named Vikram comes to the market and sells 25 contracts. John decides to liquidate 10 contracts, and hence buys 10 contracts from Vikram, effectively transferring his 10 contracts to Vikram. Arjun adds 10 more contracts from Vikram and finally Varun decides to buy the remaining 5 contracts from Vikram. In summary, 15 new contracts got added to the system. OI would now stands at 30.

Friday: Vikram decides to square off 20 of the 25 contracts he had sold previously. So he buys 10 contracts each from Arjun and Varun. This means, 20 contracts in system got squared off, hence OI reduces by 20 contracts. The new OI is 30-20 = 10. The final summary is listed in the table below.

So on and so forth; I hope the above discussion is giving you a fair sense of what Open Interest (OI) is all about. The OI information just indicates how many open positions are there in the market. Here is something you should have noticed by now. In the ‘contracts held’ column, if you assign a +ve sign to a long position and a –ve sign to a short position and add up the long and short positions, it always equates to zero. In fact this is one of the primary reasons derivatives is often termed as a zero sum game!
Have a look at the following snapshot –

As of 4th March 2015, OI on Nifty futures is roughly 2.78 Crores. It means that there are 2.78 crore Long Nifty positions and 2.78 crore Short Nifty positions. Also, about 55,255 (or 0.2% over 2.78Crs) new contracts have been added today. OI is very useful in understanding how liquid the market is. Bigger the open interest, more liquid the market is. And hence it will be easier to enter or exit trades at competitive bid / ask rates.
OI and Volume interpretation
Open interest information tells us how many contracts are open and live in the market. Volume on the other hand tells us how many trades were executed on the given day. For every 1 buy and 1 sell, volume adds up to 1. For instance, on a given day, 400 contracts were bought and 400 were sold, then the volume for the day is 400 and not 800. Clearly volumes and open interest are two different; buy seemingly similar set of information. The volume counter starts from zero at the start of the day and increments as and when new trades occur. Hence the volume data always increases on an intra-day basis. However, OI is not discrete like volumes, OI stacks up or reduces based on the entry and exit of traders. In fact for the example we have just discussed, let us summarize the OI and volume information.

Notice how OI and volume change on a daily basis. Today’s volume has no implication on tomorrow’s volume. However, it is not true for OI. From a stand-alone perspective both OI and volume numbers are pretty useless. However traders generally associate these numbers with prices to draw an inference about the market.
The following tables summarizes the trader’s perspective with respect to changes in volume and prices –
| Price | Volume | Trader’s Perception |
|---|---|---|
| Increase | Increase | Bullish |
| Decrease | Decrease | Bearish trend could probably end, expect reversal |
| Decrease | Increase | Bearish |
| Increase | Decrease | Bullish trend could probably end, expect reversal |
Unlike volumes, the change in Open interest does not really convey any directional view on markets. However it does give a sense of strength between bullish and bearish positions. The following tables summarizes the trader’s perspective with respect to changes in the OI and prices –
| Price | OI | Trader’s Perception |
|---|---|---|
| Increase | Increase | More trades on the long side |
| Decrease | Decrease | Longs are covering their position, also called long unwinding |
| Decrease | Increase | More trades on the short side |
| Increase | Decrease | Shorts are covering their position, also called short covering |
Do note, if there is an abnormally high OI backed by a rapid increase or decrease in prices then be cautious. This situation simply means that there is a lot of euphoria and leverage being built up in the market. In situations like this, even a small trigger could lead to a lot of panic in the market.
And with this, I would like to conclude this module on Futures Trading. I hope you enjoyed reading through this as much as I enjoyed writing it!
Comments
Post a Comment